How Long Does it Take the City of Boston to Fulfill 311 Service Requests?
For our project, we are interested in exploring the distribution of 311 cases in Boston. Boston 311 is a non-emergency service where residents of the city can place requests for various non-emergency services. According to the city of Boston’s website, some of the top requested services include getting a pothole fixed, street cleanup, broken traffic signals/street signs, etc. We are interested in examining the duration of these cases and identifying how this varies with other factors (e.g. case subject, day of year on which the case was opened, racial demographics and relative income levels where the service was requested, etc).
We begin our analysis by first exploring the main variables of interest in each of our datasets, including subject, case status, race, and income.
Graphs and Description
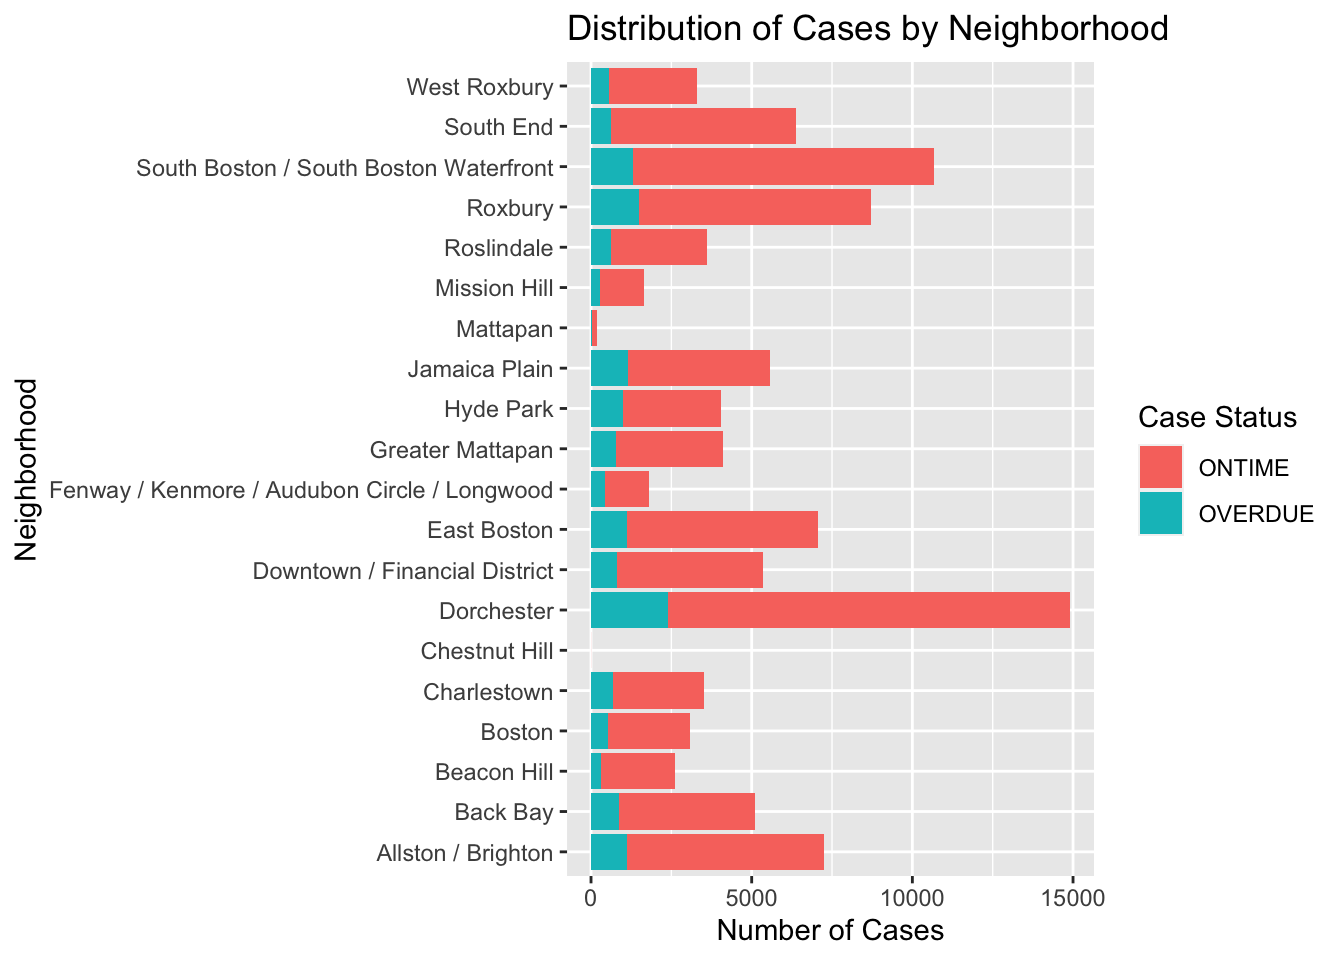
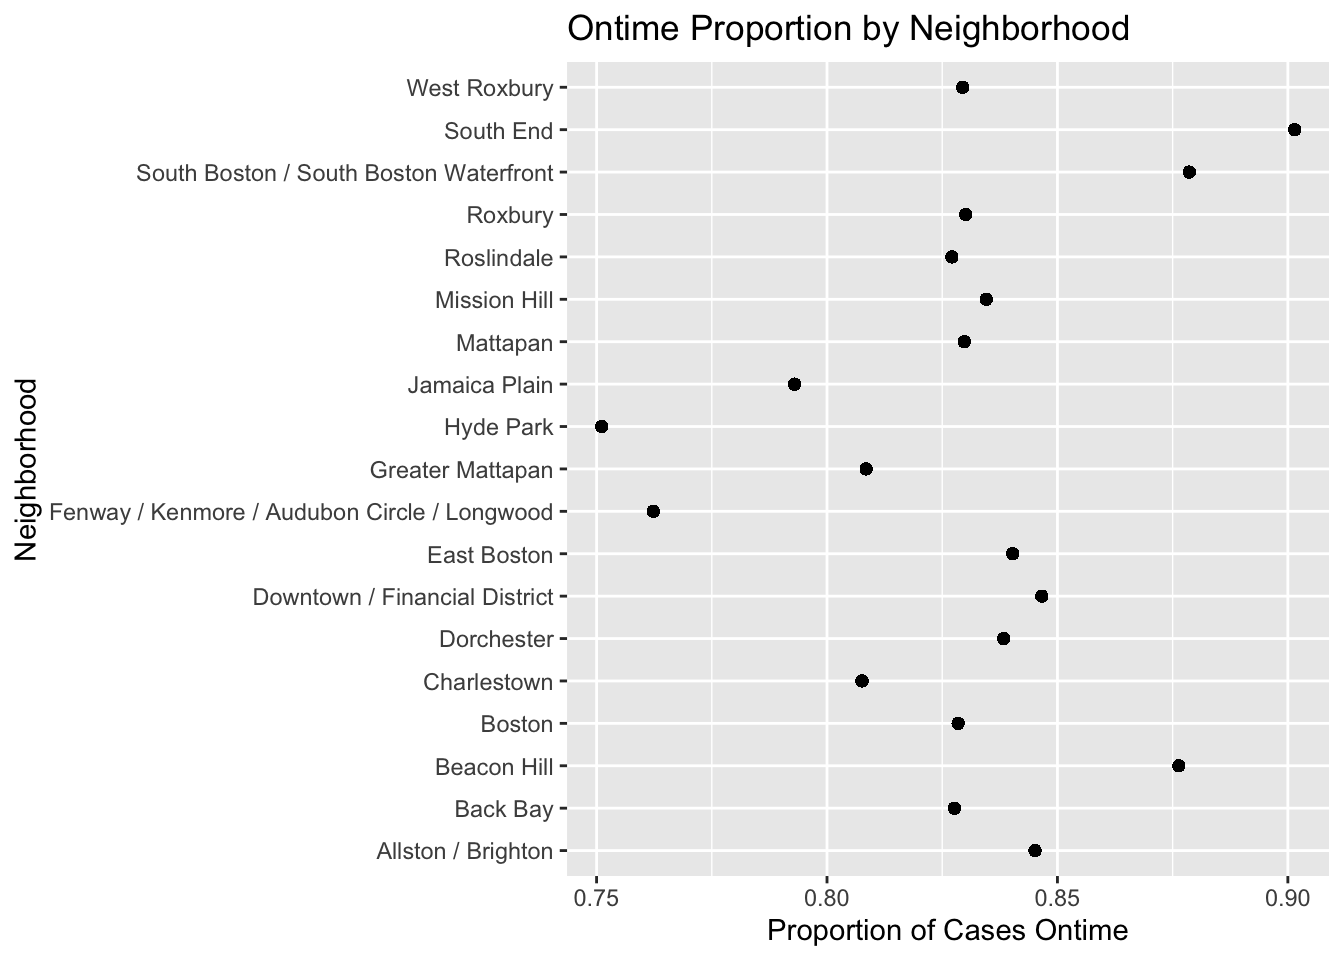
These graphs allow us to see the number of ontime and overdue cases in various neighborhoods of Boston, along with the relative proporiton of ontime cases in each neighborhood. We can see from the bar graph that Dorchester has the highest number of total cases, with Mattapan having the fewest after Chestnut Hill, which has 0 reported cases. In the second graph, we can see that most neighborhoods have a high proportion of cases fulfilled ontime. The neighborhoods with the lowest and highest rates of ontime cases are Hyde Park and the South End, with ontime rates of roughly 0.75 and 0.9 respectively. Ultimately, we find that 311 cases are not uniformly distributed across Boston’s neighborhoods (which is expected given population variation), but most neighborhoods have similar rates of ontime case fulfillment.
Case Number vs. Reason
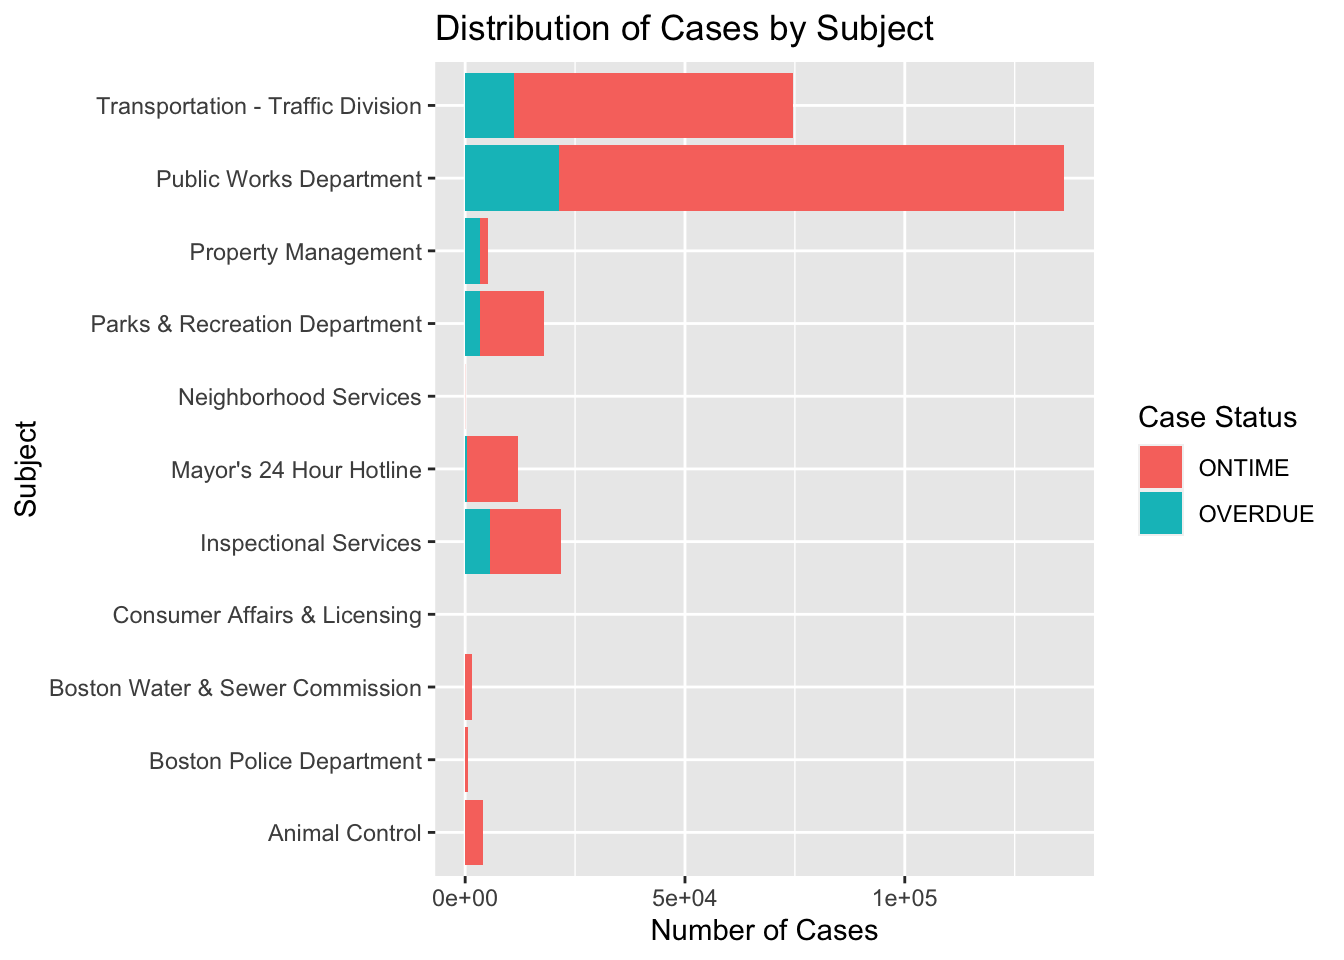
 This first graph is simply a bar chart of the number of cases for each subject in our dataset, colored by the status of the case. We can see that Public Works and Transportation are the two subjects with the most cases and these cases clearly represent the majority of all Boston 311 cases.
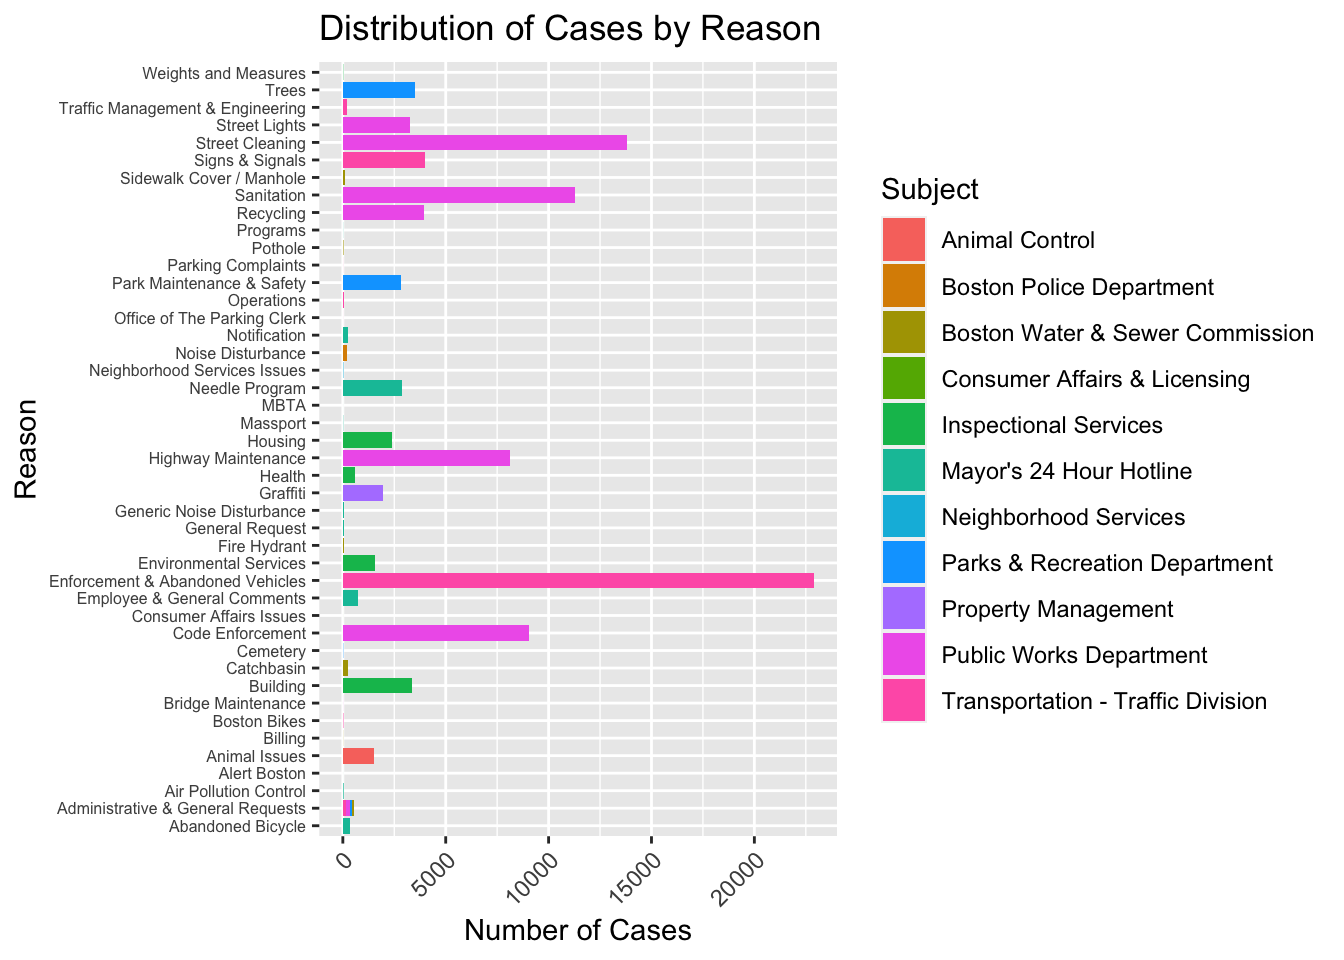
The next graph is an overview of the number of cases grouped by case reason, colored by case subject. We can see that cases regarding Enforcement & Abandoned Vehicles occurred most frequently in Boston, and we calculate that these cases accounted for roughly 22% of all Boston 311 cases in 2021. Aside from these, cases about Street Lights, Sanitation, Highway Maintenance and Code Enforcement are also the top reasons that people called 311 for, all of which fall under the subject of Public Works. We find that these four reasons for request represent roughly 42% of all 311 cases.
Closed Case by Subject
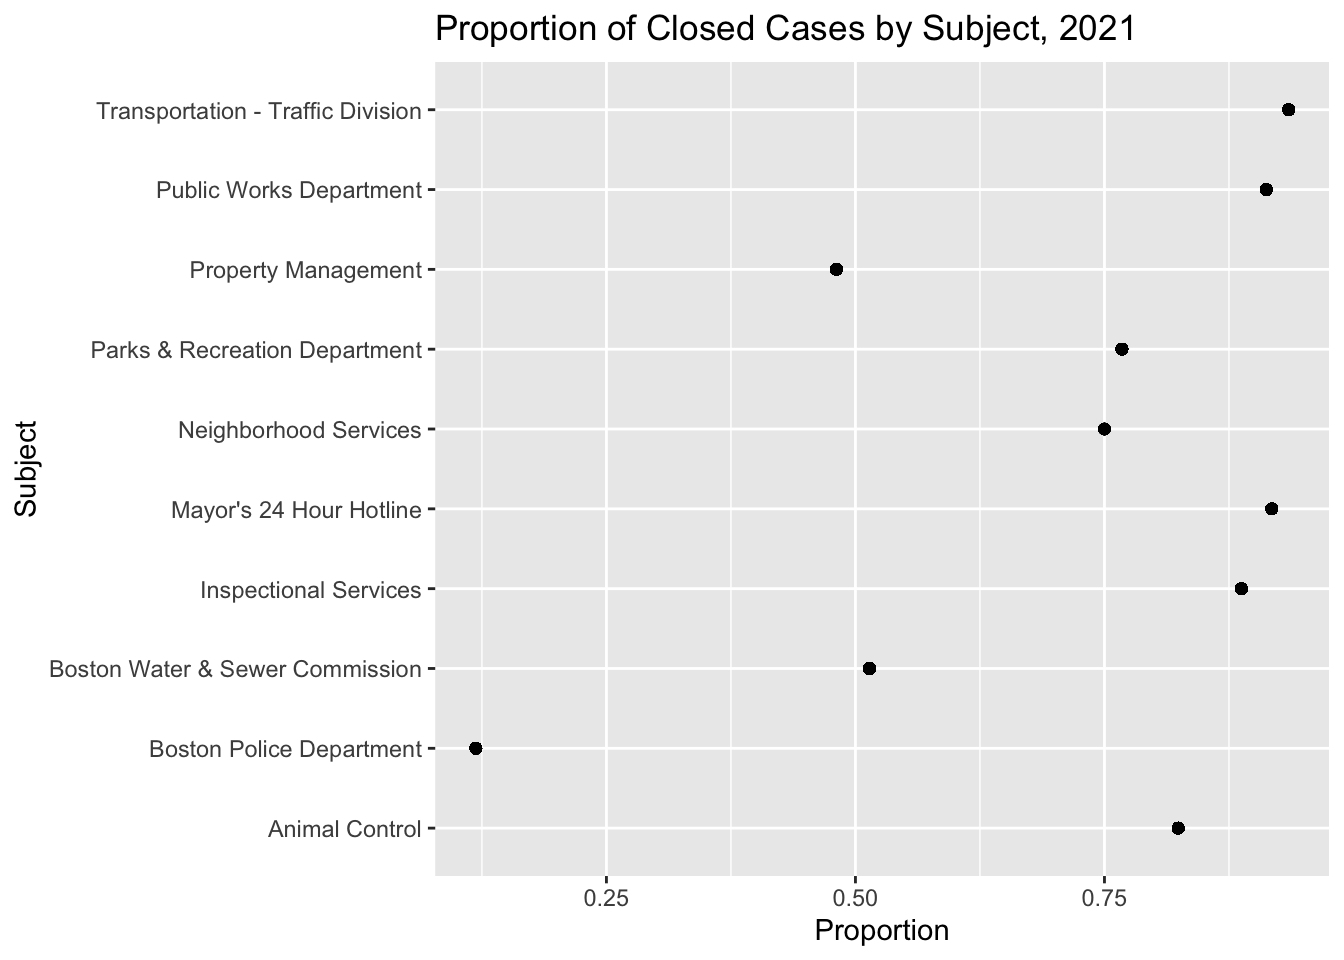
The graph shows the proportion of closed cases for each subject. The cases under the subjects of Transportation, the Mayor’s 24 Hour Hotline, and Public Works Department have the highest closing proportions, all of which are larger than 90%. In contrast, the Boston Police Department has the lowest closing rate, close to 20%. We found earlier that Transportation and Public Works cases account for nearly 65% of cases, so it is interesting that these two subjects have such high fulfillment rates given the number of cases being handled.
Boston Race Distribution
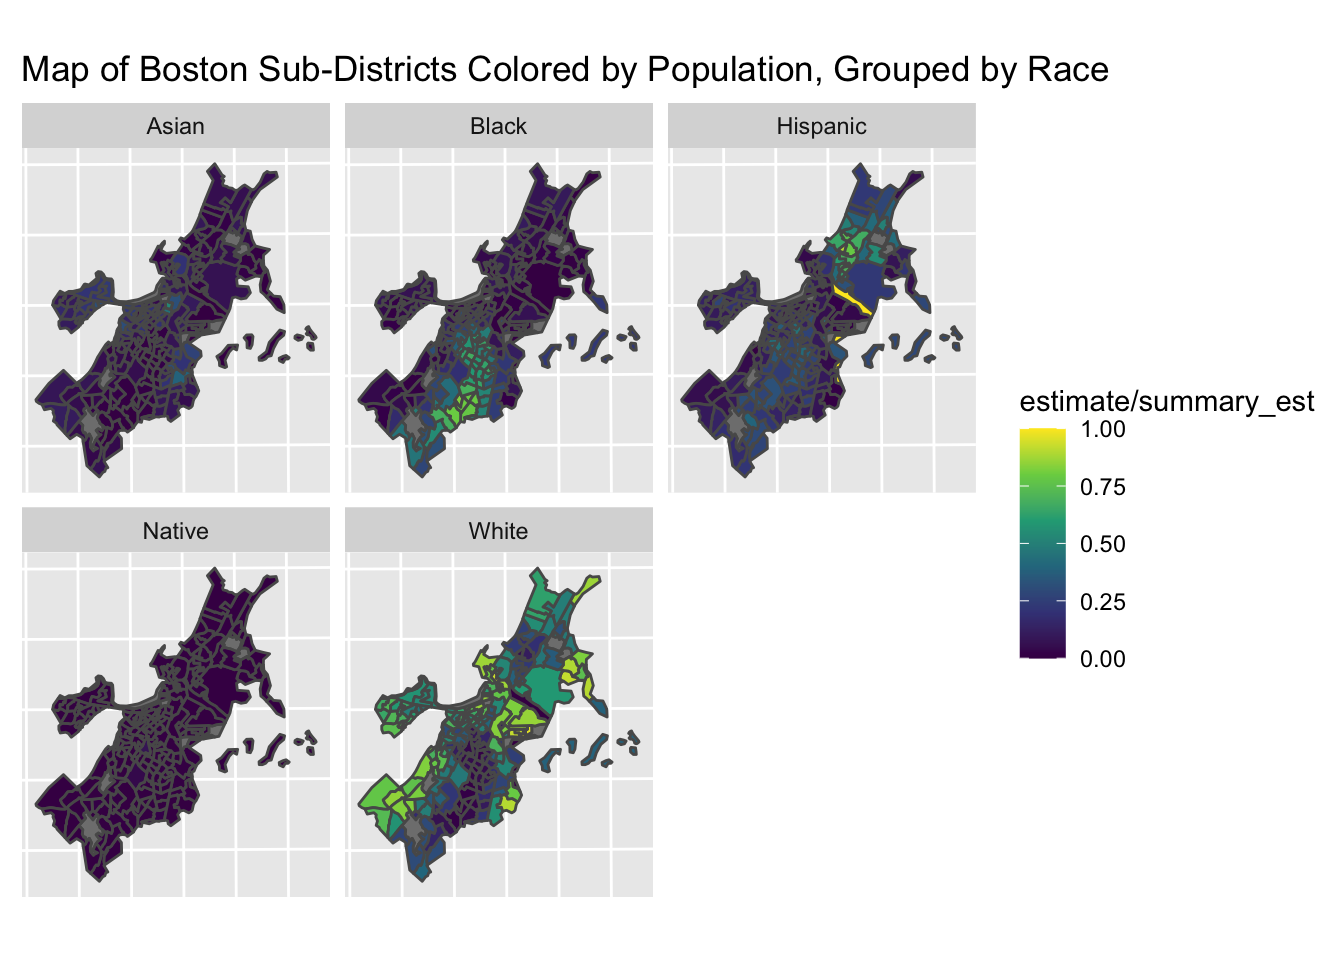
In this map, we are showing the relative population proportions of each racial group in the city of Boston. We are interested in exploring this data because we plan explore the correlation between the proportion of people of a certain specified race living in a sub-district of Boston and the duration of cases in that sub-district. If we find a significant correlation between these variables, this would suggest that the duration of 311 cases in a specified area of Boston is related to the racial distribution within the population of that area. If we find no correlation, we conclude that there is no significant relationship between these factors. This map shows us that Boston’s population is predominantly white in many areas. It is clear that Boston’s racial distribution is not uniform, and the proportion of people of a specified racial group living in a certain sub-district of Boston clearly varies with location.
Boston Income Distribution
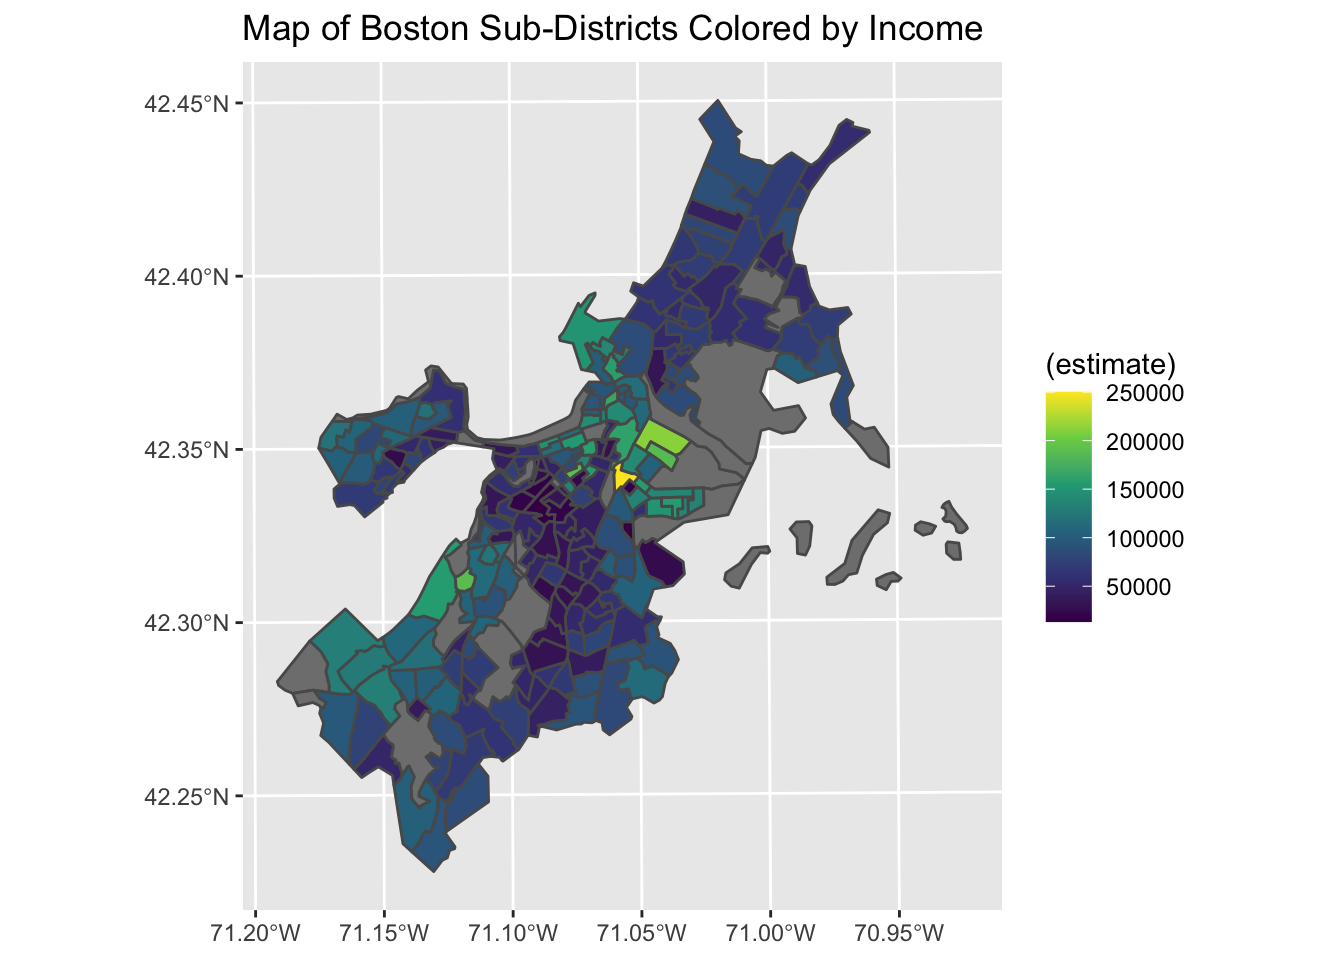
The graph shows the distribution of income levels in Boston. The average income level is highest in the center of Boston. We see that most of the wealth appears to be concentrated in a few sub-districts of Boston, with the rest of the sub-districts having a much lower average income. We also are missing income data for several of the sub-districts, so there will inevitably be some variation that we are unable to account for. There does not appear to be any pattern as to how income varies with location, though it does vary widely.
Interactive
Here is a link to our interactive: https://larcenciel1112.shinyapps.io/311_int/
Conclusion
We have now introduced and explored the main variables of interest from each of our datasets. We first observe that the distribution of Boston’s 311 cases is not spatially uniform, however on-time case fulfillment rates do not appear to vary much with location. We next find that cases in Transportation and Public Works account for nearly 65% of all 311 cases in Boston, while also having the highest rates of on-time case fulfillment. We finally observe that the distributions of income and race are both non-uniform across Boston. We model duration with respect to these variables in our Analysis section, and comment there on which variables are significantly related to the duration of cases.
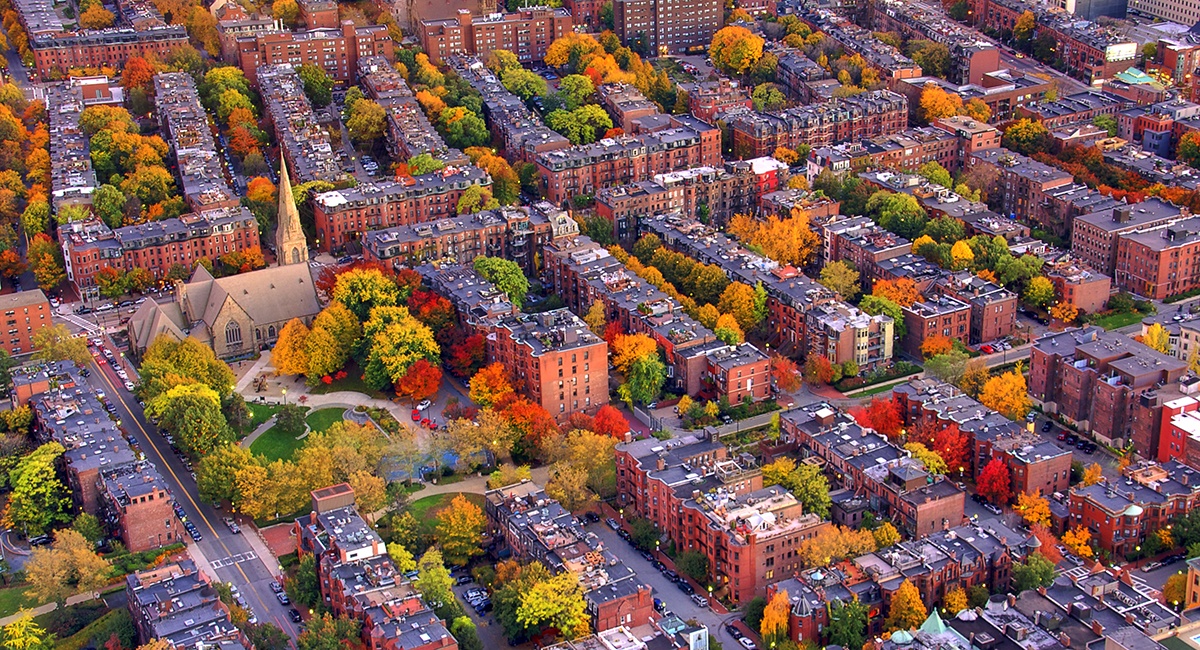
Header image source: https://www.bostonmagazine.com/property/2020/10/13/boston-ranked-best-places-to-live/