##Dataset Loading and Cleaning
We did most of our data cleaning in the previous post. Here, we are adding a column to clean_311 called “closed” which is FALSE when the case_status is open or NA and TRUE when the case_status is closed. Essentially, we are converting case_status to a logical column, and assuming that when case_status is NA, the case is not closed.
suppressPackageStartupMessages(library(tidyverse))
suppressPackageStartupMessages(library(sf))
## Warning: package 'sf' was built under R version 4.1.2clean_311 <- read_csv(here::here("dataset", "clean_311_data"))## Rows: 50000 Columns: 18## ── Column specification ────────────────────────────────────────────────────────
## Delimiter: ","
## chr (14): ontime, case_status, case_title, subject, reason, type, queue, de...
## dbl (1): fire_district
## date (3): open_dt, target_dt, closed_dt##
## ℹ Use `spec()` to retrieve the full column specification for this data.
## ℹ Specify the column types or set `show_col_types = FALSE` to quiet this message.clean_311$closed <- ifelse(clean_311$case_status %in% c("Closed"), TRUE, FALSE)
clean_311$duration <- difftime(clean_311$closed_dt, clean_311$open_dt, units = "days")##Exploratory Data Analysis
We continue our exploratory data analysis by creating a plot of the duration of cases, filled by the case subject, for all cases fulfilled within 90 days. We find that most cases from Animal Control, the Boston Police Department, and the Boston Water and Sewer Commission are fulfilled within the first month, whereas other case subjects have longer durations. This trend could be due to there being fewer cases from these three departments, or possibly because these departments are handling more urgent requests. We next examine the distribution of the proportion of closed cases across subjects. We see that the Boston Police Department, Property Management, and the Boston Water and Sewer Commission have the lowest rates of case-fulfillment, all three of which have case fulfillment rates less than 50%.
clean_311 %>%
  filter(duration < 90) %>%
  ggplot() +
  geom_bar(aes(duration, fill = subject)) +
  scale_y_log10() +
  labs(title = "Duration of Cases Colored by Subject")
## Don't know how to automatically pick scale for object of type difftime. Defaulting to continuous.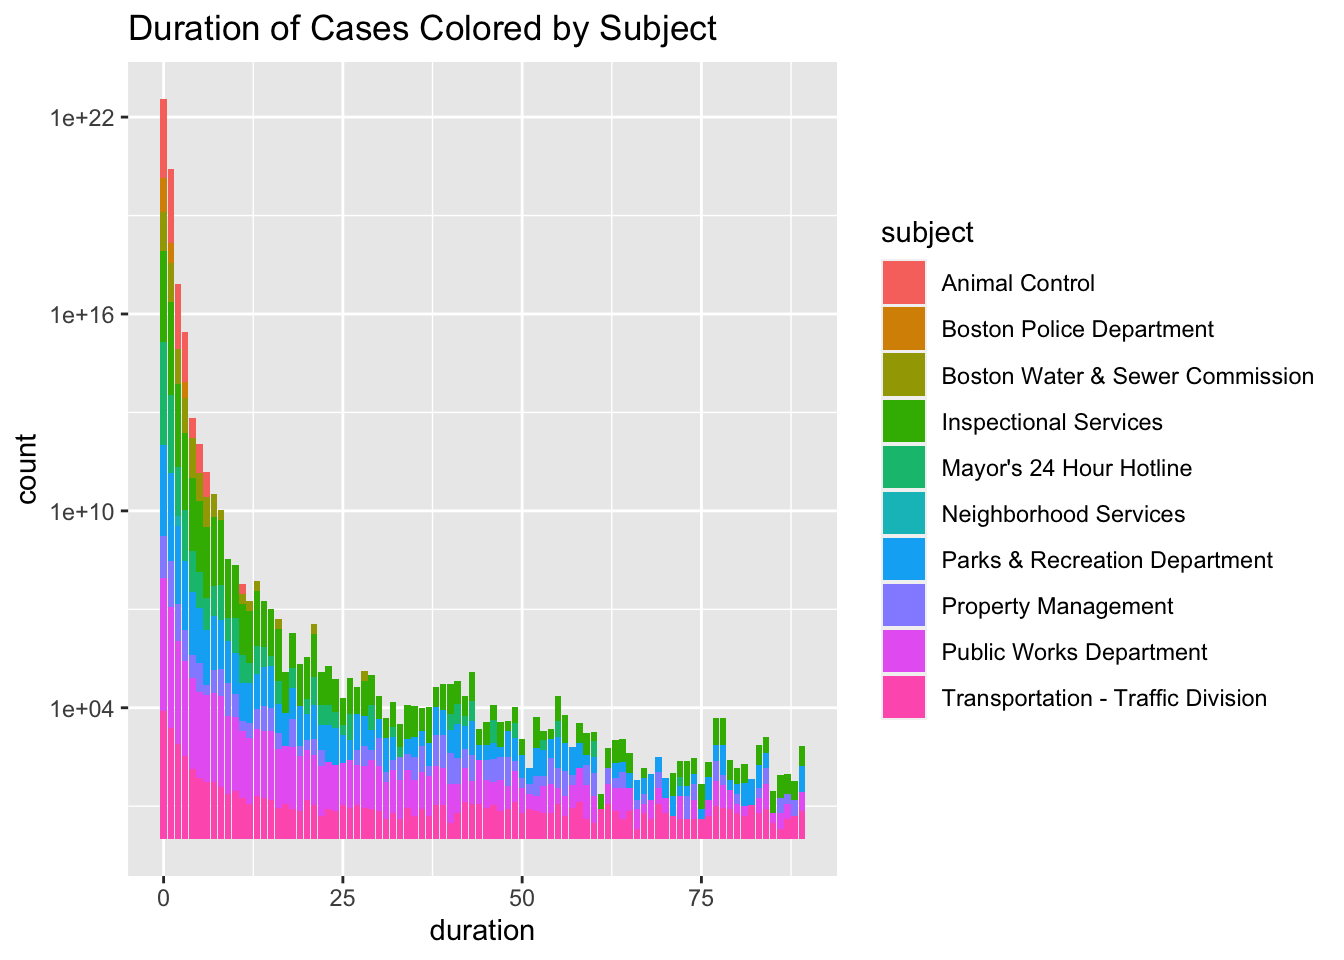
clean_311 %>%
  filter(!is.na(subject)) %>%
  group_by(subject) %>%
  mutate(prop = mean(closed)) %>%
  ggplot() +
  geom_point(aes(subject, prop)) +
  coord_flip() +
  labs(x = "Proportion", y = "Subject", title = "Proportion of Closed Cases by Subject, 2021")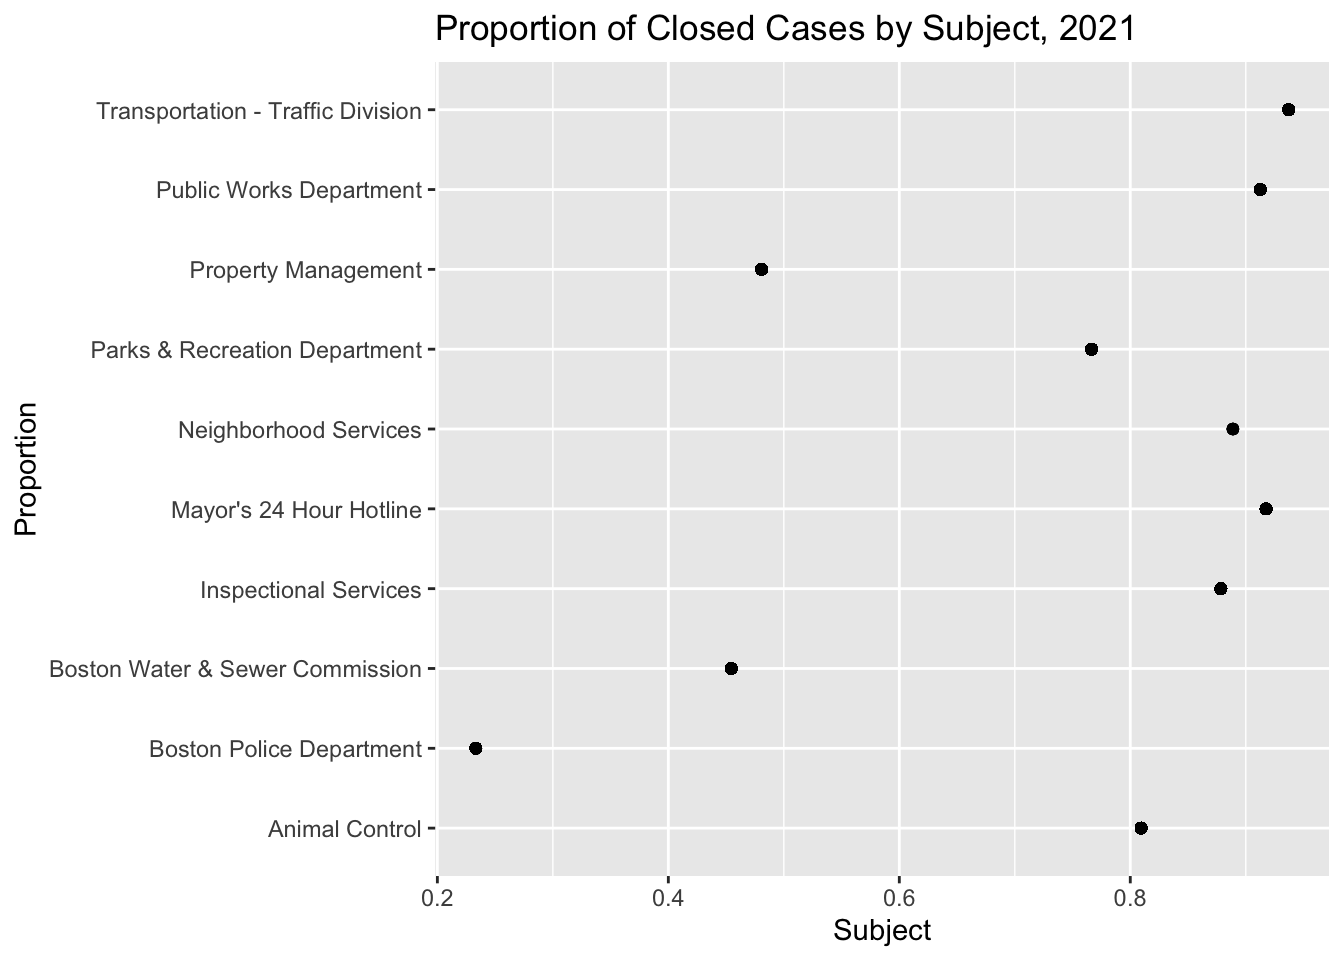
df_311 <- read_csv(here::here("dataset-ignore", "311_data.csv"))## Rows: 273951 Columns: 29## ── Column specification ────────────────────────────────────────────────────────
## Delimiter: ","
## chr (20): ontime, case_status, closure_reason, case_title, subject, reason,...
## dbl (6): case_enquiry_id, fire_district, city_council_district, neighborho...
## dttm (3): open_dt, target_dt, closed_dt##
## ℹ Use `spec()` to retrieve the full column specification for this data.
## ℹ Specify the column types or set `show_col_types = FALSE` to quiet this message.coord_data <- df_311 %>%
select(neighborhood, longitude, latitude) %>%
sample_n(50000) %>%
st_as_sf(coords = c("longitude", "latitude")) %>%
st_set_crs(4326) %>%
st_transform(26986)
bos_neighborhoods <- st_read(here::here("dataset/Boston_Neighborhoods", "Boston_Neighborhoods.shp"), quiet = TRUE) %>%
st_transform(26986)
st_join(bos_neighborhoods, coord_data) %>%
group_by(Name) %>%
summarize(n = n()) %>%
ggplot() +
geom_sf(aes(fill = n)) +
labs(title = "Map of Neighborhoods Colored by Number of Cases")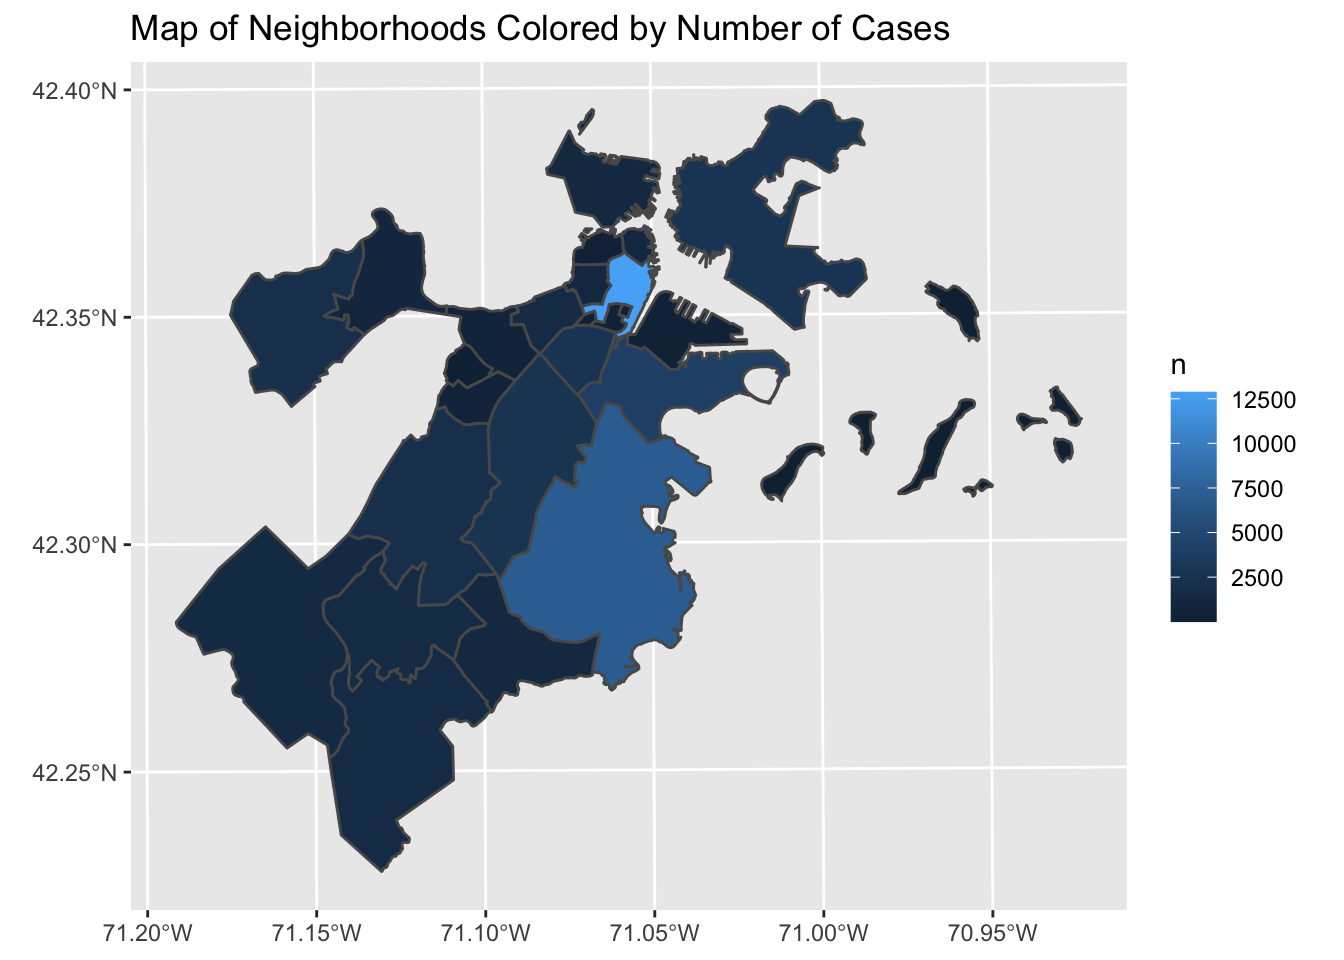
##Data for Equity
Our dataset includes the specific addresses of some individuals who have requested city services and information about the service they requested. Some analysis based on this information may infringe personal privacy. However, the address data does not only contain personal addresses, but rather the addresses of locations in Boston where city services were requested. Therefore, it is unlikely that the address data poses a privacy risk to the included subjects.
Our data set contains few variables that are considered sensitive topics, and few cases that are related to the Boston Police Department. For our second data set, we are interested in using census data, and plan to look at racial equity data. We will be aware of the sensitive topics in our dataset and analysis and try to reduce any potential harm by focusing our analysis on possible improvements to be made in the Boston community as opposed to the disclosure of disparities.
Our dataset includes the detailed information of requesting city service across different neighborhoods. There may be some trends showing that residents in some districts may make more frequent requests for certain services which may imply certain issues on maintenance of public order. Combining those findings with the census data in Boston may reinforce some stereotypes for certain neighborhoods, even the race group.
We don’t know whether the people who made the city service requests authorized the city of Boston to collect their data and upload detailed information about their requests and address online. Our dataset records the city service requests within a year. It is only about what kinds of city services are made by people. Our analysis can only reflect the preference and frequencies on making the city service request of people in certain districts. It cannot be used to examine the living environment of neighborhood or neighborhood quality.